Apple’s new MLX post closes on a number: four Mac Studios running an 816-billion-parameter model “at up to 4.6x the start-up (time-to-first-token) speed of the previous generation of Mac Studio.” That 4.6x is real and it is in Table 2. It is also in a tab that a plain HTTP fetch of the page never receives. Only the 8,192-token tab is rendered into the HTML a crawler gets; the 65,536-token column ships inside the JavaScript payload, and 4.6x lives in the second one.
This matters less as a gotcha about Apple’s web stack than as a reminder of where the walls are. The post is unusually generous with raw numbers for a vendor write-up, and its own best figure is the one hardest to find. So here is the full recount, both tabs, against the three claims the post makes.
Claim 1: up to 4.6x faster time to first token
Verified, and it is the large-context figure. Taking Apple’s own Table 2, single-machine M5 Ultra against single-machine M3 Ultra:
- Qwen 3.8, 8,192 tokens: 18.2s to 4.1s — 4.44x
- Qwen 3.8, 65,536 tokens: 199.4s to 43.7s — 4.56x
- Mistral Medium 3.5, 8,192 tokens: 95.9s to 24.6s — 3.90x
- Mistral Medium 3.5, 65,536 tokens: 1,097.9s to 273.0s — 4.02x
The headline is “up to”, and 4.56x is the ceiling of the four. Three of the four sit below it and one, the smaller-context Mistral run, is a 3.90x — below the “up to” by two-thirds of a turn. Apple states the prose figure as “up to 4.6x … (see Figure 2)”, so the hedge is doing its job honestly. But note which cell is the ceiling: both 4.4x-plus cells are Qwen 3.8, the 27B model, and both sub-4.1x cells are the 128B Mistral. The ratio is worse on the bigger model.
Two of those four numbers — 199.4 and 1,097.9 — are in the hidden tab. A reader fetching the page without a browser sees the 8,192 column only, where the best figure available is 4.44x.
Claim 2: 36 tokens per second on four machines
Verified exactly: “On a cluster of four Mac Studios, Muse Spark Open generates over 36 tokens per second.” Table 3 gives 36.73 tok/s at an 8,192-token context under four-machine tensor parallelism. At 65,536 tokens the same configuration returns 34.66, which is still over 34 but no longer over 36. The opening sentence does not state a context size; the table does.
For scale, the model would need “more than 1.6TB of RAM in its native precision (BF16) for the model parameters alone”, down to “about 493GB” in NVFP4. Four Mac Studios at 512GB each is the configuration being described. Apple’s own framing is “right from your desk”, which is accurate about physical location and silent about what the desk costs.
Claim 3: parallelisation helps
This is the one that needed counting, because “notably, dense architectures scale better across multiple computers” is the only comparative statement in the post and it is both true and incomplete.
Across both context tabs, both metrics and all three models there are 32 parallelism cells measured against their stated baseline. Twenty-four of them improve. Five are flat within 1%. Three regress. The regressions are worth naming individually, because two are trivial and one is not:
- Qwen 3.8 decode, two-machine pipeline, 8,192 tokens: 19.69 to 19.44 tok/s — 0.99x, noise.
- Mistral decode, two-machine pipeline, 65,536 tokens: 6.16 to 6.14 tok/s — 1.00x, noise.
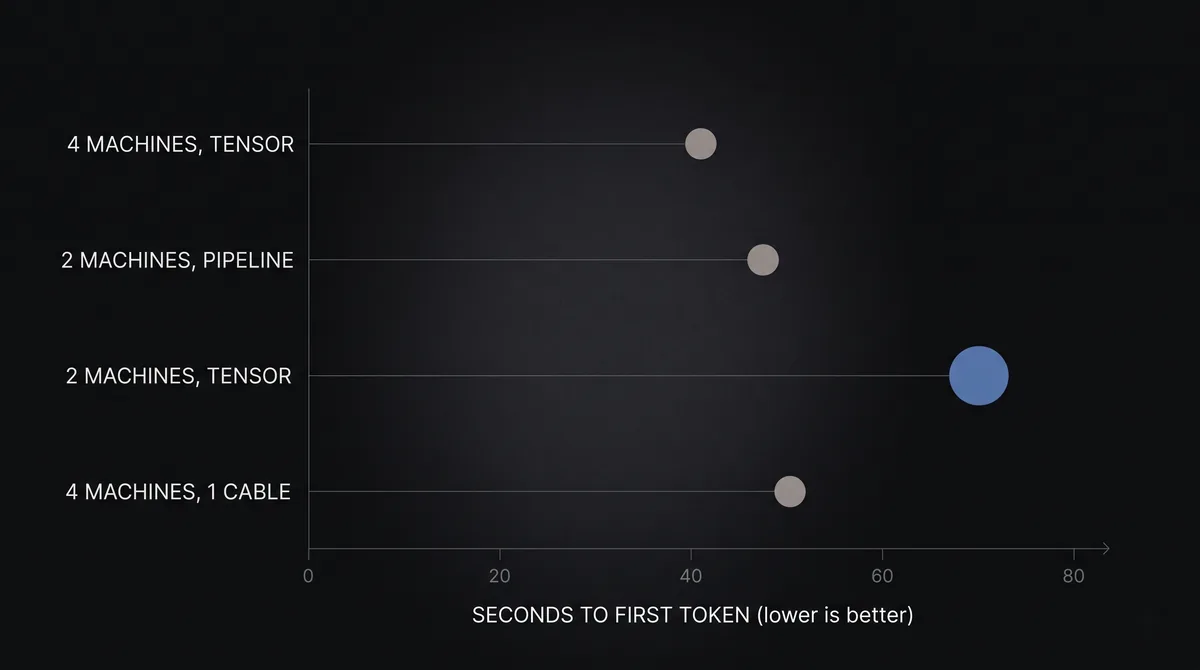
- Muse Spark Open time-to-first-token, two-machine tensor against two-machine pipeline, 65,536 tokens: 47.6s to 70.3s — 0.68x. Adding tensor parallelism across the same two machines made prefill 48% slower.
That last one is a real and substantial regression, and Apple names it before any reader could: “at very large contexts (65,536 tokens), two-machine tensor parallelization lags behind two-machine pipeline parallelization”, attributed to “separate normalization of the experts’ outputs” adding prefill communication. It recovers at four machines — 40.6s, back ahead of the pipeline baseline. So the honest shape is not “tensor parallelism is faster” but “tensor parallelism is faster once you have enough machines to pay for its communication”, which is what the post says in prose and what the number in the hidden tab proves.
The post also discloses a figure that works against its own tidiest story. Four machines at 65,536 tokens took 50.5s on one Thunderbolt cable per link and 40.6s on two, and Apple says plainly that the 40.6 is “the two-cable value reported in Table 2, the one-cable run being an additional experiment.” The published table is the better-cabled configuration, stated as such.
What is not checkable here
All of these numbers are Apple’s, measured on Apple’s hardware by Apple, for a post announcing Apple’s framework release. There is no third-party reproduction, and the configuration is specific enough — M5 Ultra, 512GB, RDMA over Thunderbolt 5, two cables per link, --prefill-step-size 8192 — that reproducing it is not casual work. The commands are published (mlx_lm.benchmark --model meta-models/Muse-Spark-Open-816B-A42B-NVFP4 -p 8192 -g 128 -b 1), which is more than most vendor benchmark posts offer, and the decode measurements are stated as taken “over 128 generated tokens following the context” — a short window, disclosed.
The power figures are stated in prose only, as approximately 200W for the M3 Ultra machine and 300W for the M5 Ultra, with Figure 4 carrying the actual chart. Those numbers are per machine; the four-machine configuration that produces 36.73 tok/s is not given a combined figure, and this piece does not multiply them, because peak power during a benchmark is not average power across a run.
The comparison the post does not make is against a GPU server, which is the alternative any reader weighing this is actually considering. Apple compares M5 Ultra to M3 Ultra and leaves it there. That is a fair scope for a framework release post and a real gap for anyone trying to decide something.