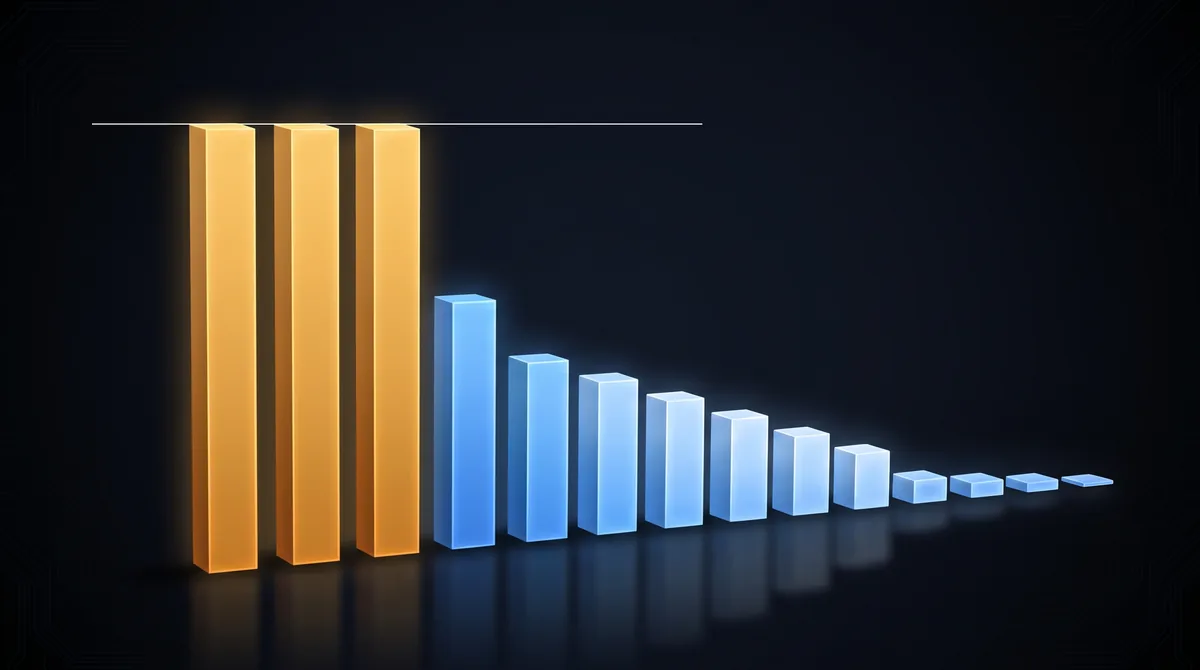
Every pass rate on the DAYJOB: Tax leaderboard divides exactly into whole trials out of 250, and once you know that, the top of the board stops being a ranking.
Surge AI published DAYJOB: Tax on 27 October, a benchmark of AI agents on professional tax work. The structure is stated plainly: “The benchmark contains 50 environments across eight areas of tax practice”, scored as “pass@1 at a 95% rubric threshold”, where “An attempt passes when it satisfies at least 95% of the task’s criteria”. The case studies describe five attempts per model. Fifty tasks at five attempts is 250 trials, and that number turns out to be recoverable from the published percentages alone.
The percentages are integer trial counts
Thirteen of the fourteen rates on the DAYJOB: Tax leaderboard are exact multiples of 1/250. The headline 10.8% is 27 trials. Second place at 9.6% is 24. Third at 9.2% is 23. The bottom of the board resolves to single trials: 1.2% is 3, 0.8% is 2, 0.4% is 1, and 0% is none at all.
The one exception is informative rather than disqualifying. Grok 4.7 is published as a flat “5%”, which at 250 trials is 12.5 — not a whole trial. Either its row is rounded for display while the others are not, or the denominator is larger. At 500 trials every one of the fourteen rates resolves exactly, so ten attempts per task is also consistent with the published figures. Surge does not state the number of attempts anywhere on either page, so both readings survive, and the article’s conclusion has to hold under each. It does.
Six places on the board are one trial apart
Take the 250-trial reading and compute the gaps between neighbours on the leaderboard. Eight of the thirteen adjacent pairs are separated by a single passing trial or less:
| Rank | Model | Rate | Trials |
|---|---|---|---|
| 1 | Claude Sonnet 5.5 | 10.8% | 27 |
| 2 | Claude Fable 5.1 | 9.6% | 24 |
| 3 | Claude Opus 5.5 | 9.2% | 23 |
| 4 | Muse Wonder 1.0 | 6% | 15 |
| 6 | GPT 6 Astra | 4.8% | 12 |
| 7 | GPT 6.1 Sol | 4% | 10 |
| 8 | Muse Spark 1.3 | 3.6% | 9 |
| 9 | Gemini 4 Argon | 3.2% | 8 |
| 10 | Hy4 Preview | 1.6% | 4 |
| 11 | DeepSeek V4.1 Flash 1017 | 1.2% | 3 |
| 12 | Gemini 3.8 Flash | 0.8% | 2 |
| 13 | glm 5.3 | 0.4% | 1 |
| 14 | Qwen 3.8 Max | 0% | 0 |
Second and third place are 24 trials against 23. One tax assignment, scored by a rubric with a 95% pass bar, decides which of two models is runner-up. The four bottom rows are separated by one trial each, in sequence: 4, 3, 2, 1. Ranks 11 through 14 are distinguished by a combined six passes.
Run a Wilson 95% interval on each and the top three sit inside each other: rank 1 at [7.5%, 15.3%], rank 3 at [6.2%, 13.4%]. A two-proportion test on rank 1 against rank 3 gives p=0.55. Against rank 2, p=0.66. The blog’s own sentence — “Claude Sonnet 5.5 leads with a 10.8% pass rate… followed by Claude Fable 5.1 at 9.6% and Claude Opus 5.5 at 9.2%” — describes an ordering its own numbers cannot distinguish from noise.
Under the 500-trial reading the intervals narrow, as they must, and the top three still do not separate: p=0.53 for rank 1 against rank 2, p=0.40 against rank 3. The specific claim survives the ambiguity about N.
What the numbers do separate
This is where the house shape would be to call the leaderboard meaningless, and that would be wrong about the data. The gap between the leading cluster and everything below it is real. Rank 1 against rank 6 (GPT 6 Astra) is p=0.012 at 250 trials and smaller at 500. Rank 1 against rank 9 (Gemini 4 Argon) is p=0.001. The finding that three Anthropic models occupy a band roughly twice as high as the next vendor’s best is supported; the finding that they are in the order shown is not.
Surge is also careful in a way the arithmetic does not undercut. It does not claim statistical separation anywhere. Neither page contains the words “significant” or “confidence” in any statistical sense, and there is no error bar on the leaderboard chart. The overclaim is in a sentence that reads as a ranking, not in an asserted significance test that fails. On the substantive question the benchmark was built to answer, the summary is blunt against its own subject: “Agents haven’t yet passed the audit”, and “Even when agents can perform the individual steps, exercising professional judgment and reliably carrying out real-world tax workflows remain out of reach.” A vendor benchmark whose top score is 10.8% is not a marketing document.
The case studies cut the other way too
The two worked examples in the post are the strongest material on the page, and they are strongest precisely because the per-model verdicts split.
In the first, a client wants to know whether to sell a condo in October 2026 or January 2027. Both dates clear the residence requirement for an exclusion worth up to $250,000, but eligibility expires around the end of August 2027 and neither date was the one at risk. Surge reports: “Across five attempts, Astra never identified the deadline. Opus identified it in all five attempts.” Five for five against zero for five.
In the second, a separating couple asks how to divide a Roth IRA and a 401(k). Opus 5.5 opened a response with “You aren’t legally married, so neither account can be split without triggering taxes and penalties”, and “Across all five attempts, Opus based its recommendations around the assumption that the couple was unmarried, even when it acknowledged uncertainty.” The records showed prior cohabitation in Texas and a ceremony in Colorado, which could make the marriage valid. Astra got this one: it “recognized the need to verify their marital status in four of five attempts”, one response advising “We first need to confirm your legal marital status.”
So the model that was five-for-five on the condo deadline was zero-for-five on the marital status, and the model that missed the deadline entirely caught the assumption four times out of five. Two tasks, two opposite results, from a pair of models whose aggregate scores are 23 and 12 trials apart. That is what a 250-trial board looks like underneath: per-task behaviour that does not track the ordering.
What is not checkable here
The number of attempts per task is the load-bearing unknown, and it is not published. I inferred 250 from the denominator fit and the case studies’ repeated “five attempts”, but Surge never states it, and the Grok row is evidence against it. The full benchmark is available only on request to benchmarks@surgehq.ai, so the per-task results that would settle whether the top three differ on any consistent subset cannot be examined. The cost-per-trial Pareto chart is an image with no published table, so I have not recounted it, and I make no claim about cost. I did not verify the three expert reviewers’ credentials or the “three-layer expert review” process; those are Surge’s own statements about its methodology, reported here as such.
The arithmetic above is reproducible from two public pages. The thing it reveals is not an error — it is a resolution limit, and the leaderboard renders one decimal place of precision it does not have.